Oil & Gas Industry by Company
The industry that still supplies most of the world's energy, tracked across its five segments: integrated majors, exploration and production, refining, midstream, and oilfield services. The investment story is capital discipline: after a decade of overspending, the industry now returns cash instead of chasing growth, while AI datacenter power demand has pulled natural gas back into the growth conversation.
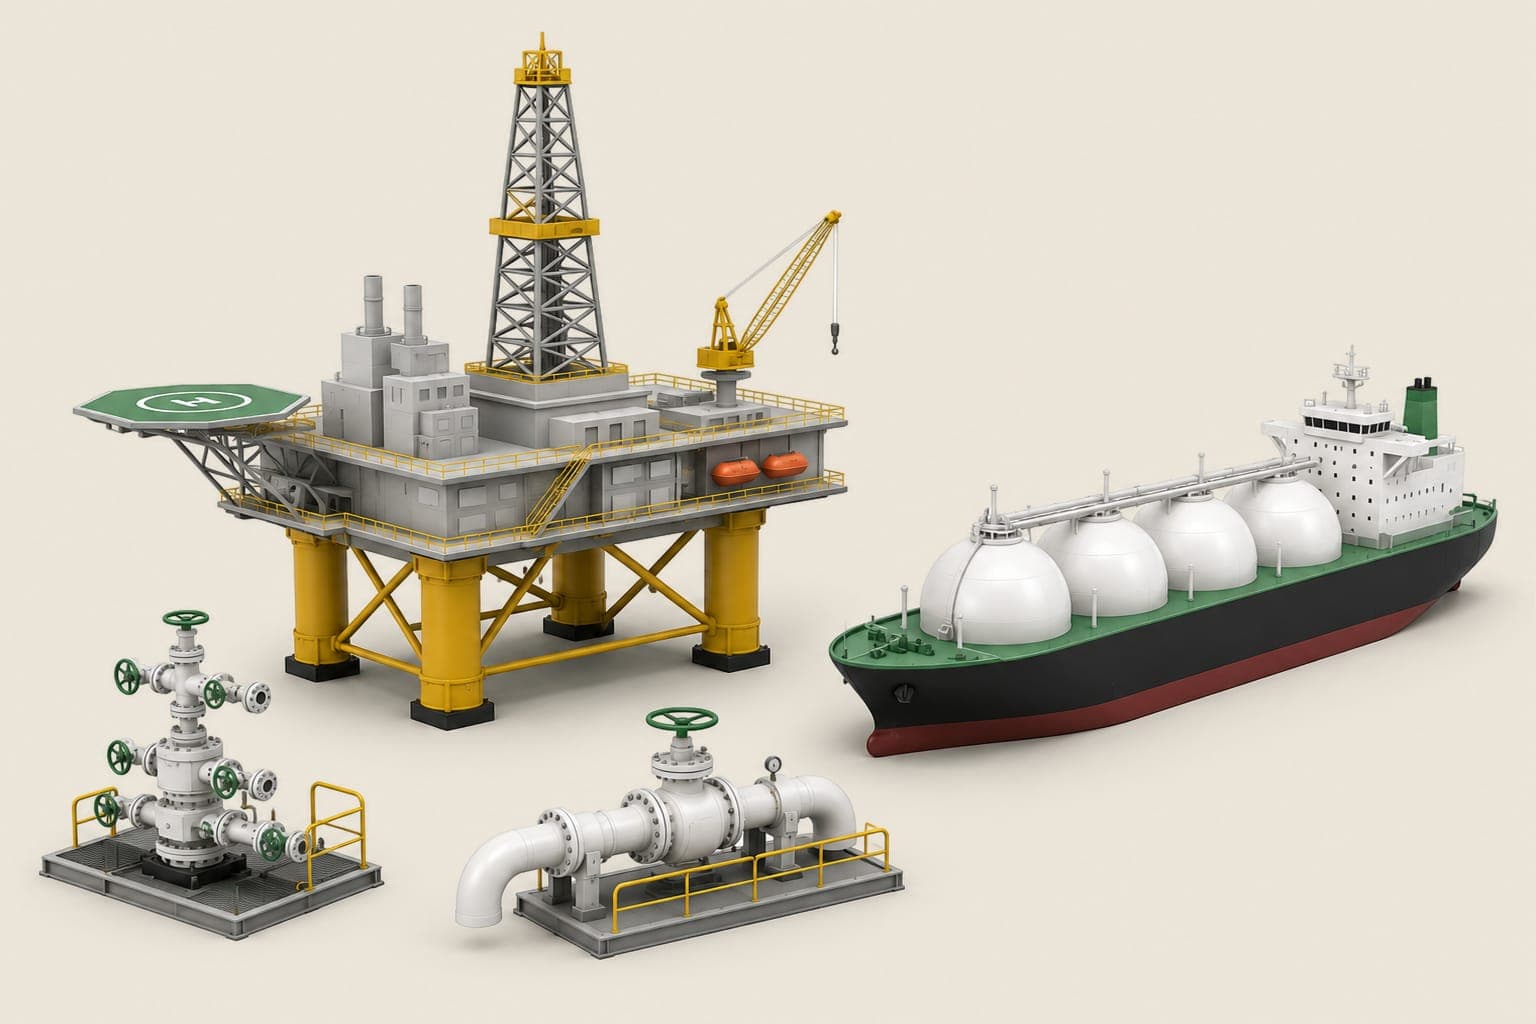
The Oil & Gas sector on Sterling tracks 41 companies, led by ExxonMobil (12.8%), Shell (10.6%), BP (7.5%) by market share.
Oil & Gas market share by company (FY2025)
| # | Company | Market share |
|---|---|---|
| 1 | ExxonMobilXOM FY2025 revenue $323.9B | 12.8% |
| 2 | ShellSHEL FY2025 revenue $266.9B | 10.6% |
| 3 | BPBP FY2025 revenue $189.3B | 7.5% |
| 4 | ChevronCVX FY2025 revenue $184.4B | 7.3% |
| 5 | FY2025 revenue $182.3B | 7.2% |
| 6 | FY2025 revenue $132.7B | 5.2% |
| 7 | Phillips 66PSX FY2025 revenue $132.2B | 5.2% |
| 8 | ValeroVLO FY2025 revenue $122.7B | 4.9% |
| 9 | EquinorEQNR FY2025 revenue $106.2B | 4.2% |
| 10 | PetrobrasPBR FY2025 revenue $88.1B | 3.5% |
| 11 | FY2025 revenue $82.6B | 3.3% |
| 12 | EniE FY2025 revenue $82.2B | 3.2% |
Oil and Gas at a Glance
- •The 40 tracked companies generated roughly $2.5 trillion of revenue in FY2025, led by ExxonMobil at $323.9B. Share of tracked revenue is a universe metric, not global market share: national oil companies like Saudi Aramco sit outside it.
- •Capital discipline has replaced growth: US drilling activity remains far below its 2014 peak even at healthy prices, with free cash flow going to dividends and buybacks instead of rigs.
- •Natural gas carries the growth story. The US is the world's largest LNG exporter with a second wave of Gulf Coast terminals under construction, and AI datacenter power demand has made gas-fired electricity the sector's newest demand driver.
- •Consolidation has remade US shale: ExxonMobil-Pioneer, Chevron-Hess, ConocoPhillips-Marathon Oil, Diamondback-Endeavor, and the Chesapeake-Southwestern merger (now Expand Energy) all closed within roughly two years.
- •Segment economics diverge sharply: FY2025 operating margins ran roughly 17-35% in E&P, 11-37% in fee-based midstream, and 3-4% at the refiners, all inside the same sector label.
Five Businesses, One Label
| Business | What it earns | Cycle clock | FY2025 op. margin range | Tracked names |
|---|---|---|---|---|
| Upstream (E&P) | The barrel and the molecule, at the commodity price minus finding and lifting cost. | Almost mechanical with crude and Henry Hub. | 17% to 35% | COP, EOG, OXY, CNQ, FANG, DVN, APA, AR, EQT, EXE, PR, MTDR |
| Integrated majors | Upstream plus refining, chemicals, and often LNG and trading, which smooths the cycle. | Smoothed version of the commodity clock. | 5% to 32% | XOM, CVX, SHEL, BP, TTE, E, EQNR, PBR, SU, IMO |
| Refining | The crack spread: product prices minus crude, minus operating cost. | Can invert the upstream cycle. Shortage of products is a good year even if crude is soft. | -0.2% to 4% | PSX, MPC, VLO, DINO, PBF |
| Midstream | Fees for moving, storing, fractionating, and (for Cheniere) liquefying hydrocarbons. | Mostly ignores the commodity. Volume and contract mix matter more than WTI. | 11% to 37% | KMI, WMB, LNG, ET, EPD, OKE, TRGP |
| Oilfield services | Rigs, crews, equipment, and (for Baker Hughes IET) LNG turbines sold into everyone else's capex. | Lags drilling budgets by quarters. Levered to activity, not to the price itself. | 6% to 15% | SLB, HAL, BKR, NOV, FTI, WFRD |
Crude and Natural Gas Benchmarks
US Field Production of Crude Oil
US Crude Production, Annual Average
US Crude Production, Product Demand, and Crude Exports
Tracked Universe Revenue by Segment
Margins Across the Whole Sector
US Extraction Output and Drilling Activity
Sector Milestones
- Nov 2014
OPEC defends share, shale crash begins
US tight-oil growth meets an OPEC decision not to cut. WTI's 2014-2016 collapse is the first shale capital-destruction cycle.
- Dec 2015
US crude export ban repealed
Light tight oil can leave the Gulf Coast. The crude-export line on this page starts its real life here.
- Feb 2016
First Cheniere Sabine Pass cargoes
The US LNG export series leaves zero. The midstream growth engine of the next decade is a set of trains, not a set of crude pipes.
- Apr 2020
WTI prints negative
Storage at Cushing fills. The industry rewrites the objective function from production growth to free cash flow.
- Mar 2022
Russia invades Ukraine
Diesel leaves the Atlantic basin. The 3-2-1 crack on the Refining tab spikes for a reason that has nothing to do with US crude production.
- Oct 2023
ExxonMobil agrees to buy Pioneer
Start of the two-year US shale consolidation wave (Pioneer, Hess, Marathon Oil, Endeavor, Chesapeake-Southwestern).
- Jun 2024
EIA retires the Drilling Productivity Report
Basin production and DUC series move into STEO tables 10a and 10b, which is what the Upstream tab now plots.
- Jan 2025
Chevron-Hess and related shale deals close into 2025
Guyana and Permian barrels concentrate into fewer, better-capitalized operators. Production step-ups in 2025 10-Ks are acquisitions.
- Aug 2026
IEA cuts 2026 world demand 1.6 mb/d
August 2026 Oil Market Report, under a Strait of Hormuz closure assumption. Modeled world balance, not a US tank gauge.
IEA Oil Market Report, August 2026
| Item | IEA figure | Window | Note |
|---|---|---|---|
| World oil demand, year-on-year change | -1.6 mb/d | 2026 | 510 kb/d weaker than the July report. Hormuz closure and elevated fuel prices are the stated drivers. |
| World oil demand, year-on-year change | -4.9 mb/d | 2Q 2026 | Deepest quarterly contraction in the 2026 path. |
| World oil demand, year-on-year change | -2.8 mb/d | 3Q 2026 | Contraction eases from 2Q. |
| World oil demand, year-on-year change | Returns to growth | 4Q 2026 | IEA: growth of 580 kb/d in 4Q26 in the August report. |
| World oil demand, year-on-year change | +2.4 mb/d | 2027 | Rebound year in the same report. |
| World oil supply, year-on-year change | -4.3 mb/d | 2026 | August report. July-August hostilities cut the 3Q26 supply path by 1.7 mb/d versus July. |
| World oil supply | 110.3 mb/d after +8.3 mb/d rebound | 2027 | IEA projection, not a history series. |
Companies in the Oil & Gas sector (41)
- ExxonMobil
- Chevron
- Shell
- BP
- TotalEnergies
- Eni
- Equinor
- Petrobras
- Suncor
- Imperial Oil
- ConocoPhillips
- EOG Resources
- Occidental
- Canadian Natural
- Diamondback
- Devon Energy
- APA Corporation
- Antero Resources
- EQT Corporation
- Expand Energy
- Permian Resources
- Matador Resources
- Phillips 66
- Marathon Petroleum
- Valero
- HF Sinclair
- PBF Energy
- Kinder Morgan
- Williams
- Cheniere
- Energy Transfer
- Enterprise Products
- ONEOK
- Targa Resources
- SLB
- Halliburton
- Baker Hughes
- NOV
- TechnipFMC
- Weatherford
- Texas Pacific Land Corporation
Related industries
Frequently asked questions
What is the Oil & Gas sector?
The industry that still supplies most of the world's energy, tracked across its five segments: integrated majors, exploration and production, refining, midstream, and oilfield services. The investment story is capital discipline: after a decade of overspending, the industry now returns cash instead of chasing growth, while AI datacenter power demand has pulled natural gas back into the growth conversation.
Which companies lead the Oil & Gas sector?
Sterling tracks 41 companies in Oil & Gas, led by ExxonMobil (13%), Shell (11%), BP (8%), Chevron (7%), TotalEnergies (7%) and Marathon Petroleum (5%).
How can I invest in the Oil & Gas sector?
Publicly traded names in Oil & Gas include ExxonMobil (XOM), Chevron (CVX), Shell (SHEL), BP (BP) and TotalEnergies (TTE). Compare them side by side on Sterling. Data last updated August 30, 2026.


Prefer Sterling in Google
Add sterlingcharts.com as a preferred source so our charts can appear with a preferred badge in Google Top Stories, AI Mode, and AI Overviews.