EV Market Share by Company
Explore the companies driving the electric vehicle revolution. Discover key players, compare product lineups, and track the shift from combustion to electric.
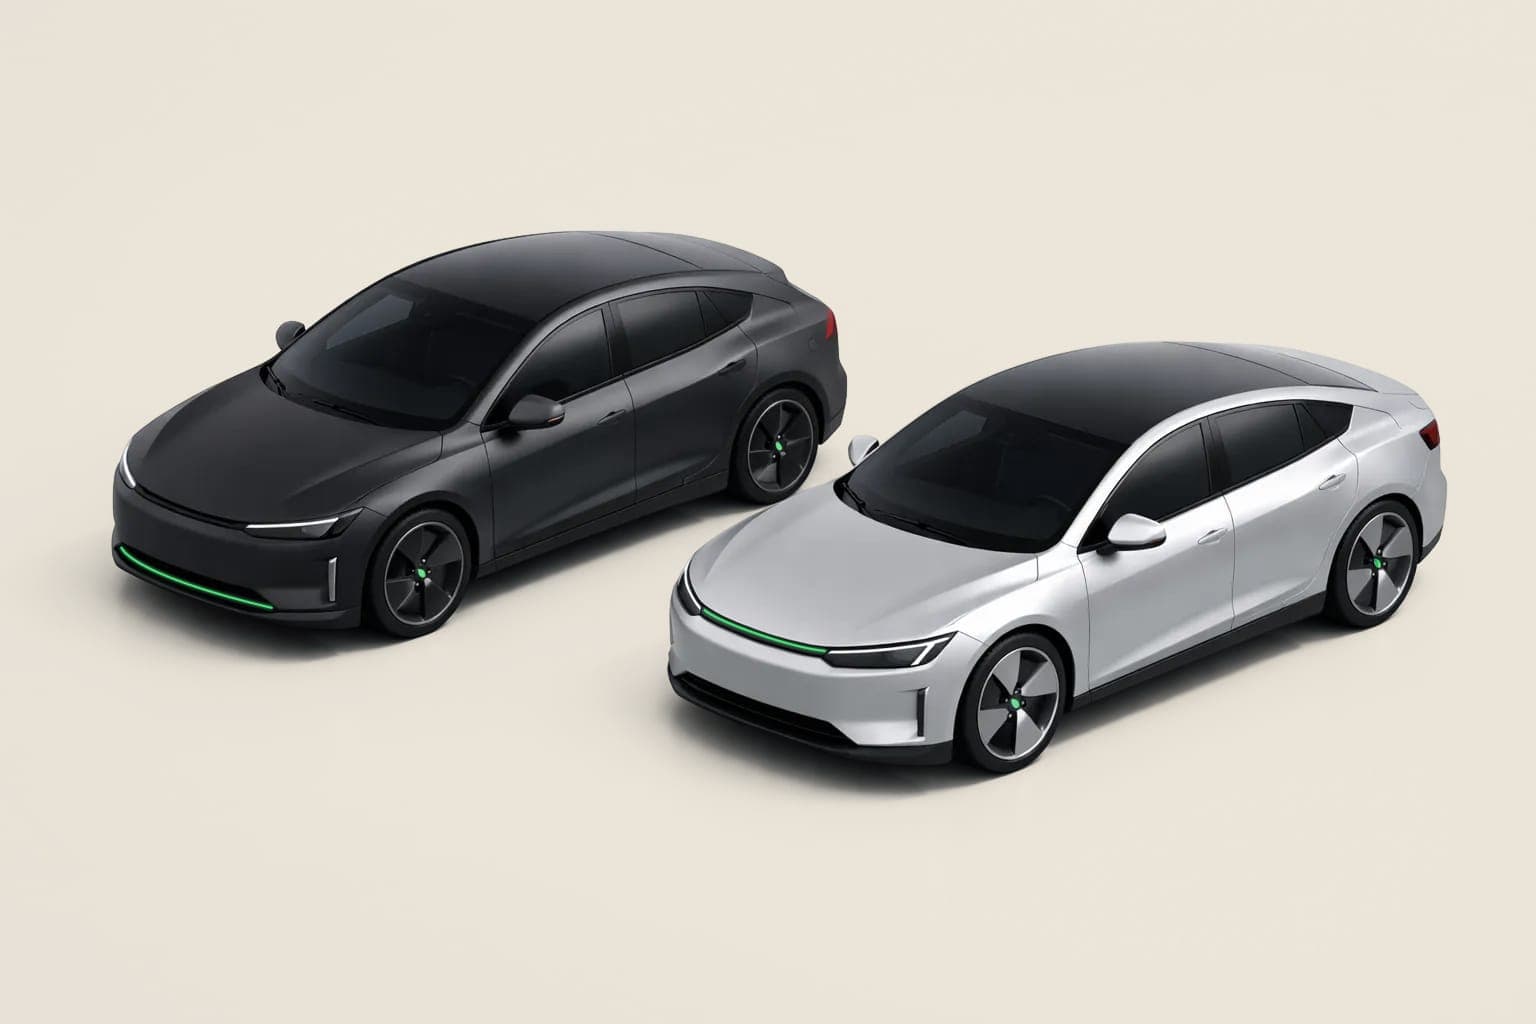
The Electric Vehicles sector on Sterling tracks 34 companies, led by BYD (20.9%), Geely (7.7%), Tesla (7.4%) by market share.
Electric Vehicles market share by company (2025)
| # | Company | Market share |
|---|---|---|
| 1 | BYDBYDDY BYD FY2025 ~4.6M NEV; #1 BEV globally with 2.26M BEV | 20.9% |
| 2 | GeelyGELYF Geely Auto NEV +90% YoY; Galaxy 1.24M, ZEEKR 220K, Lynk 230K | 7.7% |
| 3 | TeslaTSLA Tesla FY2025 down 8.6% YoY; 1.59M Model 3/Y + 50.8K other | 7.4% |
| 4 | SAIC600104.SS SAIC Motor IR; includes MG and SAIC-GM-Wuling JV | 6.8% |
| 5 | Volkswagen GroupVWAGY VW Group BEV-only FY2025 +32% YoY; Europe-led | 4.5% |
| 6 | Changan000625.SZ Changan + Deepal + Avatr; rapid 2025 NEV expansion | 4.1% |
| 7 | CheryCHERY Industry estimate; privately held | 3.3% |
| 8 | Hyundai/KiaHYMTF HMG BEV+PHEV; Kia 238K + Hyundai ~440K (Ioniq 5/6/9) | 3.1% |
| 9 | Leapmotor9863.HK Leapmotor strong 2025 ramp; +82% YoY | 2.4% |
| 10 | StellantisSTLA Stellantis BEV+PHEV; estimate, FY2025 down vs 2024 amid US/EU softness | 2% |
| 11 | XPengXPEV XPeng FY2025 +126% YoY; MONA + G6 + P7+ ramp | 2% |
| 12 | BMW GroupBMW.DE BMW BEV FY2025; Q3 102.9K confirmed | 1.9% |
| 13 | XiaomiXIACY Xiaomi FY2025 +205% YoY; SU7 + YU7 (launched June 2025) | 1.9% |
| 14 | Li AutoLI Li Auto FY2025; cumulative 1.54M as of Dec 31 | 1.8% |
| 15 | NIONIO NIO FY2025 +47% YoY; ONVO + Firefly contributing | 1.5% |
| 16 | GAC Aion601238.SS CAAM passenger NEV; declining from 2024's 371K | 1.3% |
| 17 | Mercedes-BenzMBGAF Mercedes BEV+PHEV; Q3 BEV 42.6K confirmed | 1.1% |
| 18 | RenaultRNLSY Renault Group BEV+PHEV; R5 E-Tech launch boost | 1% |
| 19 | ToyotaTM Toyota BEV+PHEV global; estimate, modest growth | 0.8% |
| 20 | GM US EV sales +48% YoY; Q3 record 66.5K | 0.8% |
| 21 | FordF Ford Model e US -14% YoY | 0.4% |
| 22 | NissanNSANY Nissan BEV global; Leaf decline + Ariya | 0.4% |
| 23 | RivianRIVN Rivian FY2025; missed initial guidance, hit revised | 0.2% |
| 24 | LucidLCID Lucid FY2025 +75% YoY; Gravity SUV ramp | 0.1% |
| 25 | Others Smaller OEMs (Hozon/Neta, AITO, Voyah, IM, JAC, BAIC, VinFast, Tata, etc.) and remainder vs IEA total | 22.6% |
EV Brand Ownership Map
Stand-alone companies, multi-brand parent groups, and joint ventures across the global auto industry. Toggle between EV-shipping brands only and the full corporate portfolio.
Stand-alone
TeslaTSLA

LucidLCID

RivianRIVN

Leapmotor9863.HK

XiaomiXIACY

Li AutoLI
Tesla
TSLA
Lucid
LCID
Rivian
RIVN
Leapmotor
9863.HK
Xiaomi
XIACY
Li Auto
LI
Ownership

FordF
Ford / Model e

GM
Chevrolet / GMC · Cadillac · Buick

BYDBYDDY
Dynasty / Ocean · Denza · Yangwang · Fang Cheng Bao

Geely HoldingGELYF
Geely Auto / Galaxy · Zeekr · Lynk & Co · Volvo Cars · Polestar · Lotus

SAIC MotorSAIC
MG · Roewe · IM Motors · RISING Auto

XPengXPEV
XPeng · MONA

Cheryprivate
Chery / Jetour · Omoda / Jaecoo · Exeed

NIO
NIO (premium) · ONVO · Firefly

Changan000625.SZ
Changan / Nevo · Deepal · Avatr (JV)

GAC Group
GAC Aion (601238.SS) · Hyper

VW GroupVWAGY
Volkswagen · Audi · Porsche · Škoda · SEAT / CUPRA

Hyundai Motor GroupHYMTF
Hyundai · Kia · Genesis

BMW GroupBMW.DE
BMW + i-series · MINI · Rolls-Royce

StellantisSTLA
Fiat / Abarth · Peugeot / Citroën / DS · Jeep · Dodge / Ram · Maserati / Alfa Romeo / Lancia · Opel / Vauxhall

Mercedes-Benz GroupMBGAF
Mercedes-Benz / AMG · Maybach

ToyotaTM
Toyota / bZ · Lexus

Renault GroupRNLSY
Renault · Dacia · Alpine

NissanNSANY
Nissan
Ford
F
GM
BYD
BYDDY
Geely Holding
GELYF
SAIC Motor
SAIC
XPeng
XPEV
Chery
private
NIO
Changan
000625.SZ
GAC Group
VW Group
VWAGY
Hyundai Motor Group
HYMTF
BMW Group
BMW.DE
Stellantis
STLA
Mercedes-Benz Group
MBGAF
Toyota
TM
Renault Group
RNLSY
Nissan
NSANY
Joint Ventures
Smart
smart Automobile Co., Ltd.: relaunched as EV-only in 2019
Mercedes-Benz Group 50% · Geely Holding 50%
Avatr
Premium smart-EV brand; Huawei is a tech partner, not a shareholder
Changan 40.99% · CATL 9.17% · Huawei tech partner
Afeela
Sony Honda Mobility: first deliveries CY2026
Sony Group 50% · Honda 50%
Wuling · Baojun
SAIC-GM-Wuling: high-volume Chinese mass-market EVs
SAIC 50.1% · GM 44% · Liuzhou Wuling 5.9%
Smart
smart Automobile Co., Ltd.: relaunched as EV-only in 2019
- Mercedes-Benz Group50%
- Geely Holding50%
Avatr
Premium smart-EV brand; Huawei is a tech partner, not a shareholder
- Changan40.99%
 CATL9.17%
- Huaweitech partner
Afeela
Sony Honda Mobility: first deliveries CY2026
- Sony Group50%
 Honda50%
Wuling · Baojun
SAIC-GM-Wuling: high-volume Chinese mass-market EVs
- SAIC50.1%
- GM44%
- Liuzhou Wuling5.9%
EV Launch Calendar
New electric and plug-in models from the carmakers on this page: what is still to come, then what has launched, newest first. Filter by region.
131 models, 97 launched so far
| Model | Segment | Region | Starting price | Status |
|---|---|---|---|---|
| Still to come | ||||
| Q3 2026 | ||||
| GX7Aistaland | Mid-to-large SUV | China | Not announced | Upcoming |
| Q4 2026 | ||||
| Neue Klasse i3 sedanBMW | Mid sedan | Global | $61.5K | Upcoming |
| Roadster (next-gen)Tesla | Sports car | Global | Not announced | Upcoming |
| Next-gen Mustang Mach-EFord | Mid SUV | US + Europe | Not announced | Upcoming |
| Li i6 (new version)Li Auto | Mid SUV | China; European debut at the Paris Motor Show | Not announced | Upcoming |
| Neue Klasse iX3 (China-built 30L, 40L xDrive, 50L xDrive)BMW | Mid SUV | China | $40.4K | Upcoming |
| Mona L05XPeng | Large SUV (five-seat) | China | $25.4K | Upcoming |
| N8 (five-seat)Denza | Large SUV (five-seat) | China | Not announced | Upcoming |
| H2 2026 | ||||
| 9X SUV (overseas launch)Zeekr | Premium SUV | Overseas markets (China launch 2025) | Not announced | Upcoming |
| Model 2 / Affordable BEVTesla | Compact sedan/SUV | Global | Not announced | Upcoming |
| Lincoln EV (Aviator/Navigator electric)Lincoln | Premium SUV | US | Not announced | Upcoming |
| ET3 sedanNIO | Compact sedan | China | Not announced | Upcoming |
| D-series sedanLeapmotor | Mid-large sedan | China | Not announced | Upcoming |
| IM L7 successorIM Motors | Premium sedan | China | Not announced | Upcoming |
| Deepal G318 PHEV refreshDeepal | Mid SUV | China + export | Not announced | Upcoming |
Still to come
Q3 2026
GX7
Aistaland · Mid-to-large SUV · China
UpcomingNot announcedQ4 2026
Neue Klasse i3 sedan
BMW · Mid sedan · Global
Upcoming$61.5KRoadster (next-gen)
Tesla · Sports car · Global
UpcomingNot announcedNext-gen Mustang Mach-E
Ford · Mid SUV · US + Europe
UpcomingNot announcedLi i6 (new version)
Li Auto · Mid SUV · China; European debut at the Paris Motor Show
UpcomingNot announcedNeue Klasse iX3 (China-built 30L, 40L xDrive, 50L xDrive)
BMW · Mid SUV · China
Upcoming$40.4KMona L05
XPeng · Large SUV (five-seat) · China
Upcoming$25.4KN8 (five-seat)
Denza · Large SUV (five-seat) · China
UpcomingNot announcedH2 2026
9X SUV (overseas launch)
Zeekr · Premium SUV · Overseas markets (China launch 2025)
UpcomingNot announcedModel 2 / Affordable BEV
Tesla · Compact sedan/SUV · Global
UpcomingNot announcedLincoln EV (Aviator/Navigator electric)
Lincoln · Premium SUV · US
UpcomingNot announcedET3 sedan
NIO · Compact sedan · China
UpcomingNot announcedD-series sedan
Leapmotor · Mid-large sedan · China
UpcomingNot announcedIM L7 successor
IM Motors · Premium sedan · China
UpcomingNot announcedDeepal G318 PHEV refresh
Deepal · Mid SUV · China + export
UpcomingNot announced
Global EV Sales by Region
Annual electric car sales by region. Counts BEVs (pure battery electrics, no gas engine) plus PHEVs (plug-in hybrids: battery + small gas engine for backup). Excludes regular hybrids that can't plug in.
Global EV Market Penetration
EV penetration = electric cars as a percentage of all new cars sold. Combines BEVs (pure battery) and PHEVs (plug-in hybrids). Tracks how fast the world is switching off gasoline, 2015–2025.
Top 10 EV carmaker groups by annual battery-electric sales
BEV = Battery Electric Vehicle (pure electric, no gas engine). OEM = Original Equipment Manufacturer: the parent automaker (Tesla, BYD, Volkswagen Group, etc.). Annual pure-EV sales by parent group, 2018–2025.
BYD
2.3M
Tesla
1.6M
Geely-Volvo
1.4M
SAIC
1.1M
Volkswagen
976K
Hyundai-Kia
605K
Changan
500K
BMW
442K
Stellantis
280K
Mercedes-Benz
197K
Annual battery-electric sales, 2018 to 2025, on one scale.
EV Penetration Rate by Market
Percentage of new cars sold in each country that are electric, 2015–2024. Includes BEVs (pure battery) and PHEVs (plug-in hybrids). Norway is the global leader; the U.S. trails most peers.
Norway
97%
China
55%
Europe
28%
Thailand
23%
South Korea
11%
USA
10%
Brazil
9.0%
India
4.0%
Plug-in share of new car sales, 2015 to 2025.
EV Pure-Play Liquidity and Runway
Quarterly liquidity (cash plus short-term investments) for the five EV pure-plays, 2023-Q1 to 2026-Q2, in USD billions, with latest-quarter burn status.
Li Auto
$12.6B
NIO
$6.3B
Rivian
$5.3B
XPeng
$3.5B
Lucid
$0.8B
2023-Q1 to 2026-Q2, US$ billions, one scale.
Latest quarter (2026-Q2) status:
How much of each carmaker's mix is electric (FY2025)
Estimate, not company-reported: the splits mix deliveries, sales counts, Wikipedia production totals and Sterling estimates, so no filing reproduces every bar. FY2025 powertrain mix per automaker (BEV, PHEV/EREV, HEV, ICE+other), each bar summing to 100%, sorted by combined NEV (BEV+PHEV) share.
100.0% BEV
100.0% BEV
100.0% BEV
100.0% BEV
100.0% BEV
100.0% BEV
60.0% BEV · 40.0% PHEV
49.1% BEV · 50.8% PHEV
24.1% BEV · 27.6% PHEV
23.8% BEV · 32.1% PHEV
17.4% BEV · 8.1% PHEV
17.2% BEV · 82.8% PHEV
13.7% BEV · 17.2% PHEV
10.9% BEV · 3.3% PHEV
8.1% BEV · 1.5% PHEV · 8.6% HEV
6.1% BEV · 3.3% PHEV · 10.3% HEV
5.6% BEV · 5.6% PHEV
2.7% BEV · 5.2% PHEV · 4.5% HEV
2.7% BEV
2.5% BEV · 9.4% HEV
1.8% BEV · 1.1% PHEV · 5.4% HEV
1.3% BEV · 35.3% HEV
EV Pure-Play Quarterly Gross Margin
Quarterly group gross margin for EV pure-plays, FY2023-Q1 to FY2025-Q4 (Tesla through 2026-Q3). Higher is better; a negative margin means cars sell below build cost.
Tesla
19.6%2026-Q3
BYD
16.0%2025-Q4
Li Auto
17.8%2025-Q4
XPeng
21.3%2025-Q4
NIO
18.4%2026-Q2
Rivian
3.2%2025-Q4
Lucid
-80.7%2025-Q4
Each panel has its own scale. Dashed line: break-even.
Carmaker battery capacity and factory footprint
Battery cell plants carmakers own or co-own, with the yearly capacity each one prints.
| Carmaker | Plant | Ownership | Capacity a year | Status |
|---|---|---|---|---|
| BYD | FinDreams ChangshaNingxiang, Changsha, China | Own plant | 10 GWh | Operating |
| FinDreams ChongqingChongqing, China | Own plant | n/d | Operating | |
| FinDreams Xi'anXi'an, China | Own plant | n/d | Operating | |
| Changan | Era ChanganChina | JV with CATL | 75 GWh | Building |
| Ford | BlueOval Battery Park MichiganMarshall, Michigan, US | Own plant | n/d | Building |
| GM | Ultium Cells Spring HillSpring Hill, Tennessee, US | JV with LG Energy Solution | 45 GWh | Operating |
| Ultium Cells WarrenWarren, Ohio, US | JV with LG Energy Solution | 45 GWh | Operating | |
| Hyundai-Kia | HL-GA Battery CompanyBryan County, Georgia, US | JV with LG Energy Solution | 30 GWh | Operating |
| HLI Green PowerKarawang, Indonesia | JV with LG Energy Solution | 10 GWh | Operating | |
| HSBMA (Hyundai-SK Battery Manufacturing America)Bartow County, Georgia, US | JV with SK On | 35 GWh | Operating | |
| Mercedes-Benz | ACC Billy-Berclau DouvrinBilly-Berclau Douvrin, France | JV with Stellantis and TotalEnergies | 40 GWh | Operating |
| ACC KaiserslauternKaiserslautern, Germany | JV with Stellantis and TotalEnergies | 40 GWh | Paused | |
| ACC TermoliTermoli, Italy | JV with Stellantis and TotalEnergies | 40 GWh | Paused | |
| Nissan | AESC SunderlandSunderland, UK | Envision AESC plant | 15.8 GWh | Operating |
| Renault | AESC DouaiDouai, France | Envision AESC plant | 24 GWh | Operating |
BYD
FinDreams Changsha
Ningxiang, Changsha, China · Own plant
Operating10 GWhFinDreams Chongqing
Chongqing, China · Own plant
Operatingn/dFinDreams Xi'an
Xi'an, China · Own plant
Operatingn/dChangan
Era Changan
China · JV with CATL
Building75 GWhFord
BlueOval Battery Park Michigan
Marshall, Michigan, US · Own plant
Buildingn/dGM
Ultium Cells Spring Hill
Spring Hill, Tennessee, US · JV with LG Energy Solution
Operating45 GWhUltium Cells Warren
Warren, Ohio, US · JV with LG Energy Solution
Operating45 GWhHyundai-Kia
HL-GA Battery Company
Bryan County, Georgia, US · JV with LG Energy Solution
Operating30 GWhHLI Green Power
Karawang, Indonesia · JV with LG Energy Solution
Operating10 GWhHSBMA (Hyundai-SK Battery Manufacturing America)
Bartow County, Georgia, US · JV with SK On
Operating35 GWhMercedes-Benz
ACC Billy-Berclau Douvrin
Billy-Berclau Douvrin, France · JV with Stellantis and TotalEnergies
Operating40 GWhACC Kaiserslautern
Kaiserslautern, Germany · JV with Stellantis and TotalEnergies
Paused40 GWhACC Termoli
Termoli, Italy · JV with Stellantis and TotalEnergies
Paused40 GWhNissan
AESC Sunderland
Sunderland, UK · Envision AESC plant
Operating15.8 GWhRenault
AESC Douai
Douai, France · Envision AESC plant
Operating24 GWh
Global New-Car Mix: Plug-in EV vs Rest of Market
Share of global new cars that are BEV or PHEV versus ICE and conventional hybrids that cannot plug in. IEA series, 2015 to 2025.
Pure-Play Quarterly Deliveries
Manufacturer-reported deliveries for Tesla, BYD, NIO, Li Auto, and XPeng. BYD is NEV; Tesla is BEV only. 2023-Q1 to 2026-Q3.
BYD
1.32M
Tesla
487K
XPeng
118K
NIO
109K
Li Auto
100K
Quarterly deliveries, 2023-Q1 to 2026-Q3. Each panel has its own scale.
Pure-Play Average Selling Price
Estimate, not company-reported. Blended global automotive ASP in USD for the five pure-plays with a quarterly IR series. Mix- and FX-sensitive, not list prices.
Lithium-Ion Battery Pack Price
BNEF volume-weighted pack price for years named in public survey releases. 2025 is the BNEF survey print of $108/kWh, 8% below 2024.
2024 Battery Pack Price by Region
BNEF 2024: China $94/kWh. US packs 31% higher, Europe 48% higher. Absolute USD for US and Europe are those premia on $94.
2025 Electric Light-Commercial Vehicle Sales
IEA: 430,000 electric vans worldwide in 2025. Europe about 200,000, China about 140,000. Vans up to 3.5 tonnes.
US, EU and Canada Import Duties on Chinese EVs
Section 301 additional duty of 100% in the US from 27 Sep 2024, EU definitive CVDs from 30 Oct 2024 on top of 10% MFN, and Canada's 49,000-vehicle annual quota at the 6.1% MFN tariff from 1 Mar 2026 after its 100% surtax was repealed. Combined column stacks both layers.
- Added:
- 25.0%
- MFN:
- 2.5%
- Effective:
- 2018 action, until 26 Sep 2024
- Status:
- Superseded
25% additional 301 duty stacked on the 2.5% MFN car rate.
- Added:
- 100.0%
- MFN:
- 2.5%
- Effective:
- 2024-09-27
- Status:
- Active
Four-year review raised the EV 301 rate to 100%. Applies to Chinese-origin electric vehicles.
- Added:
- 7.8%
- MFN:
- 10.0%
- Effective:
- 2024-10-30
- Status:
- Active
Individual examination rate. Definitive duty; July 2024 provisional amounts were not collected.
- Added:
- 17.0%
- MFN:
- 10.0%
- Effective:
- 2024-10-30
- Status:
- Active
Sampled exporting producer. Five-year definitive duty on new BEVs (CN ex 8703 80 10), including vehicles with an ICE range extender.
- Added:
- 18.8%
- MFN:
- 10.0%
- Effective:
- 2024-10-30
- Status:
- Active
Sampled exporting producer.
- Added:
- 20.7%
- MFN:
- 10.0%
- Effective:
- 2024-10-30
- Status:
- Active
Cooperating companies not sampled.
- Added:
- 35.3%
- MFN:
- 10.0%
- Effective:
- 2024-10-30
- Status:
- Active
Sampled exporting producer. Same rate as residual non-cooperating companies.
- Added:
- 35.3%
- MFN:
- 10.0%
- Effective:
- 2024-10-30
- Status:
- Active
All other non-cooperating companies.
- Added:
- 0.0%
- MFN:
- 6.1%
- Effective:
- 2026-03-01
- Status:
- Active
In-quota imports pay only the 6.1% MFN tariff; the 100% surtax Canada applied to Chinese EVs on 1 Oct 2024 was repealed from 1 Mar 2026. Each shipment needs a Global Affairs Canada permit and none are allowed once the quota is used. Quota rises 6.5% a year; year 1 (1 Mar 2026 to 28 Feb 2027) is 24,500 units a period. Use so far (Global Affairs Canada EICS report updated 23 Oct 2026): 15,931 of the 49,000 year-1 quota used and 33,069 remaining, of which 15,603 in the first period (Mar to Aug) and 328 in the second (Sep to Feb).
| Jurisdiction | Measure | Added % | MFN % | Combined % | Effective | Status |
|---|---|---|---|---|---|---|
| United States | Section 301 additional duty on EVs (pre-review) | 25.0 | 2.5 | 27.5 | 2018 action, until 26 Sep 2024 | Superseded |
| United States | Section 301 additional duty on EVs | 100.0 | 2.5 | 102.5 | 2024-09-27 | Active |
| European Union | CVD, Tesla (Shanghai) | 7.8 | 10.0 | 17.8 | 2024-10-30 | Active |
| European Union | CVD, BYD | 17.0 | 10.0 | 27.0 | 2024-10-30 | Active |
| European Union | CVD, Geely | 18.8 | 10.0 | 28.8 | 2024-10-30 | Active |
| European Union | CVD, other cooperating exporters | 20.7 | 10.0 | 30.7 | 2024-10-30 | Active |
| European Union | CVD, SAIC | 35.3 | 10.0 | 45.3 | 2024-10-30 | Active |
| European Union | CVD, residual (non-cooperating) | 35.3 | 10.0 | 45.3 | 2024-10-30 | Active |
| Canada | Import quota, Chinese EVs (49,000 a year) | 0.0 | 6.1 | 6.1 | 2026-03-01 | Active |
Companies in the Electric Vehicles sector (34)
Related industries
Frequently asked questions
What is the Electric Vehicles sector?
Explore the companies driving the electric vehicle revolution. Discover key players, compare product lineups, and track the shift from combustion to electric.
Which companies lead the Electric Vehicles sector?
Sterling tracks 34 companies in Electric Vehicles, led by BYD (21%), Geely (8%), Tesla (7%), SAIC (7%), Volkswagen Group (5%) and Changan (4%).
How can I invest in the Electric Vehicles sector?
Publicly traded names in Electric Vehicles include BYD (BYDDY), Tesla (TSLA), Geely (GELYF), SAIC Motor (600104.SS) and Volkswagen Group (VWAGY). Compare them side by side on Sterling. Data last updated November 3, 2026.